

Analytics provide valuable insights to achieve personal growth. For athletes, understanding this can provide a competitive advantage – helping you understand where you’re performing well and how you can improve. Even if you already have a strong personal brand, any marketer will want to see your personal performance data before agreeing to a social media endorsement deal.
Every social channel provides a number of analytics, but they can often be hard to find. We’ll focus on the top 3 data points on each platform and where to find them.
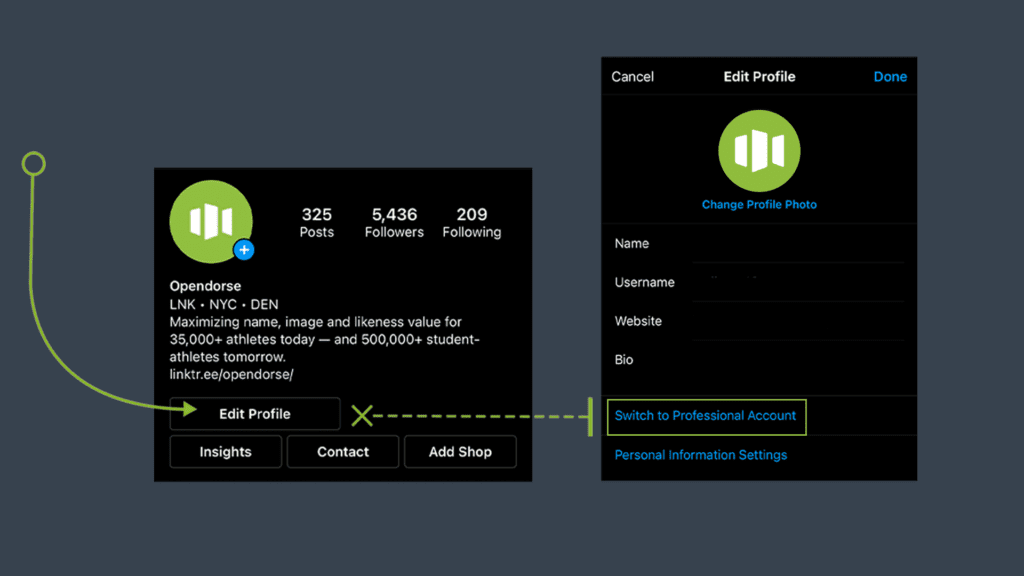
Instagram:
If you want the data, you need to update your Instagram account to a business or professional profile. You can easily update your settings and gain access to performance data.
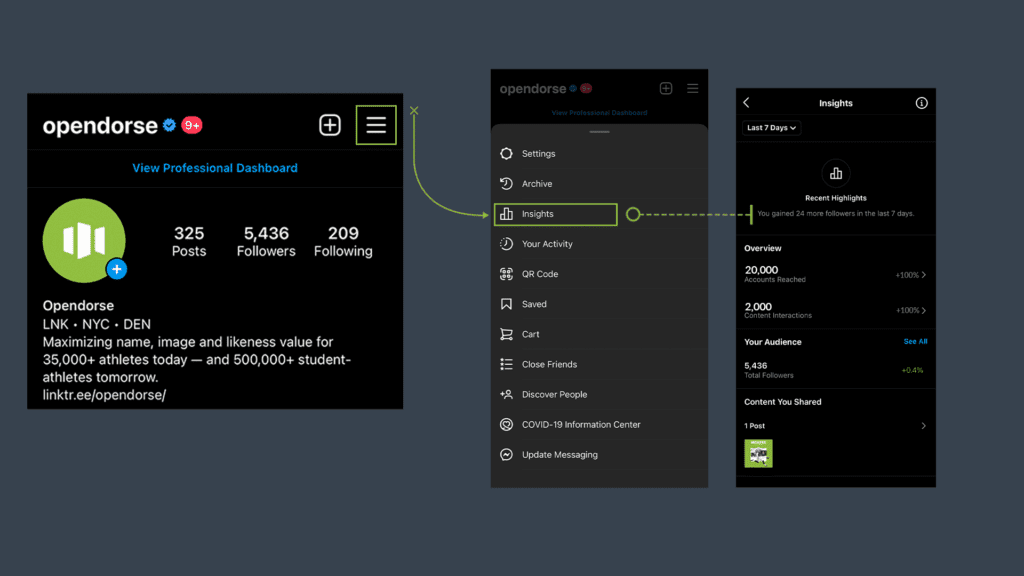
To access your analytics dashboard, tap the 3 bars in the right-hand corner and select insights.
1. Engagement Rate
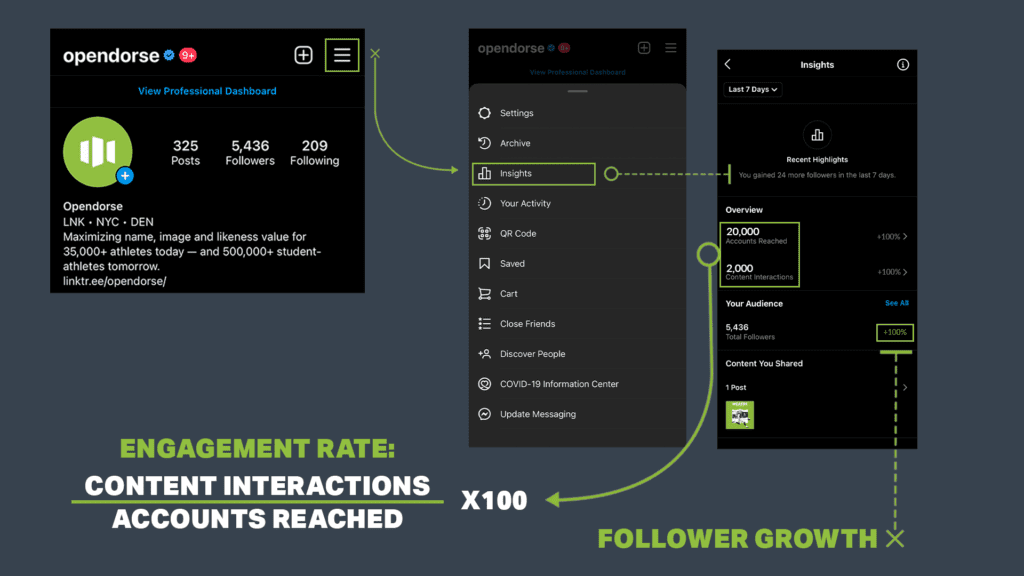
On Instagram, the engagement rate can be tricky and requires some math. However, it is beneficial to gauge how your audience is engaging with your content and what they are finding interesting. To calculate your engagement rate, head to your overview and divide content interactions by accounts reached and multiple by 100. For example, if your post reached 20,000 accounts and earned 2,000 interactions, your engagement rate is 10%.
2. Follower Growth
Your follower-count is the first thing potential partners will look to. But follower growth is the building block to a large audience. Working to understand the “why” behind your growth rate will set you up for long-term success and continued growth. Here are some questions to ask yourself when you check in on your growth number.
- Do you see your growth rate spike after a specific type of post?
- Do you see your growth rate increase after someone tags you in a post?
- Do you see your growth rate increase after you engage with other users’ content?
Identify your whys to better understand what you can do to continue this growth.
Scroll down on your analytics dashboard to find:
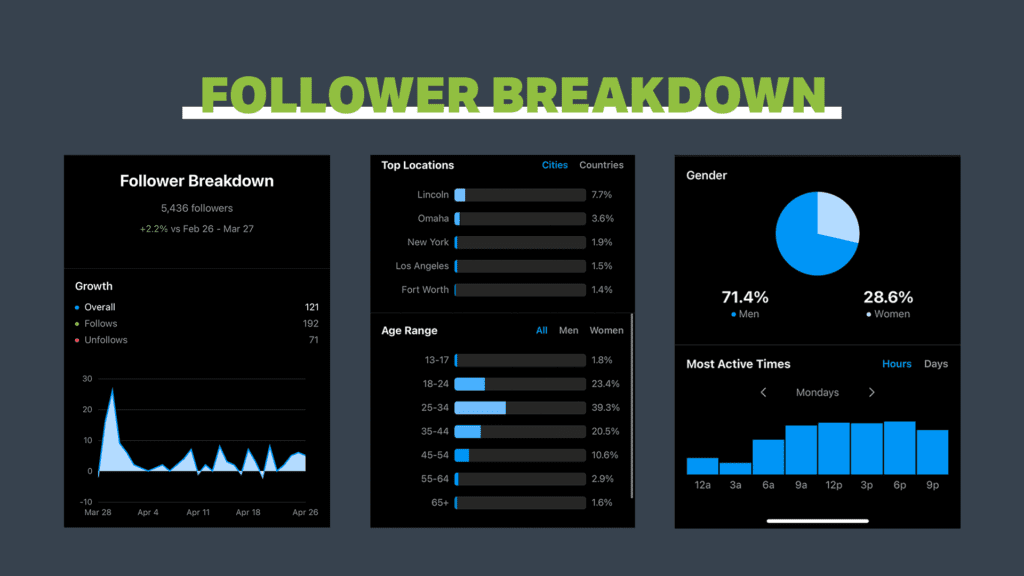
3. Follower Breakdown
The follower breakdown is probably the most underrated tool on Instagram. You can gain demographic info into who exactly is viewing your content. If your follower breakdown aligns with a brand’s target market, you’re well-positioned to earn paid opportunities.
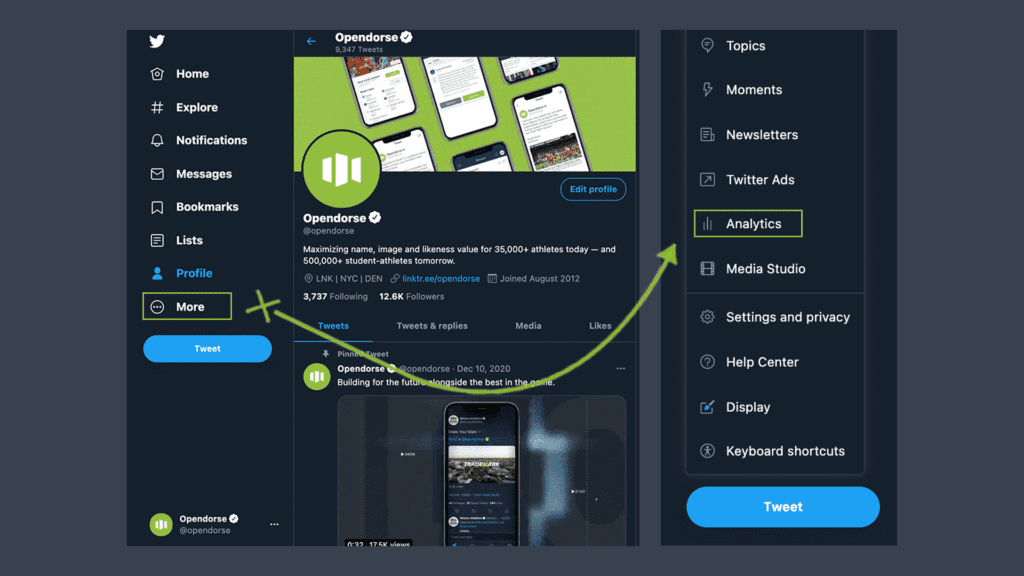
Twitter:
Twitter has an easy-to-view analytics dashboard. You can see data broken down by post or by any time frame you select. Twitter gives you a 360-view of how your content is performing and breaks down everything from the number of tweets, link clicks, and comments. You should figure out which data-points relate to your own goals, but we’ll focus on 3 key data points to track.
To access your analytics dashboard, you’ll have to log into your Twitter account via computer. You can not access your analytics through the app.
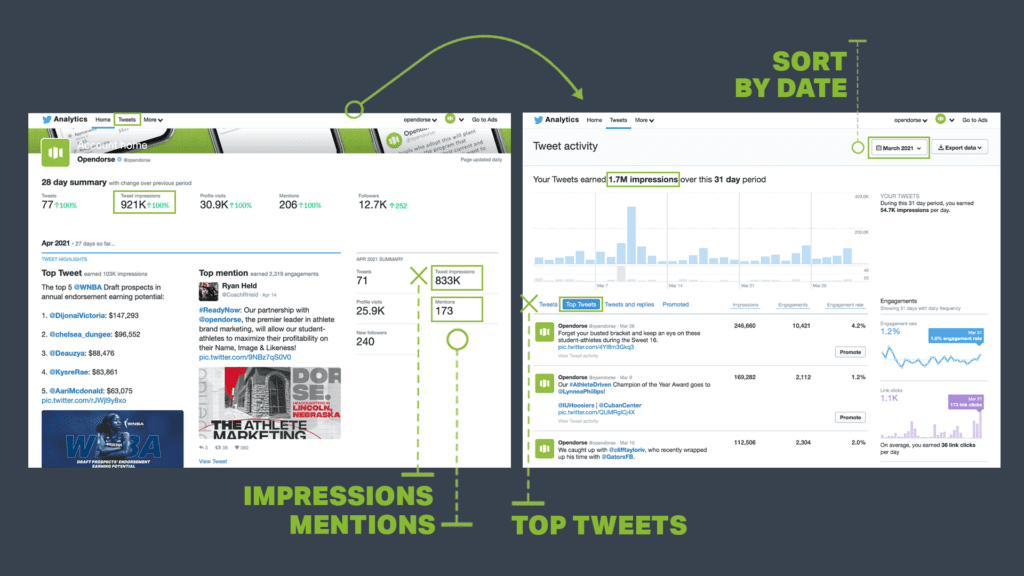
1. Impressions
You can easily view impressions on your home dashboard and see the breakdown within the past 28 days and scroll to see month over month. To gain a more in-depth view of impressions, click the “Tweets” tab and sort by date range.
Impressions measure how many eyes are on your content. When you post more and increase your following, you’ll see this metric rise. Impressions are different than engagements, they serve as views compared to interactions, so you’ll see a much higher number here.
To increase impressions:
- Post more frequently
- Comment and retweet other users’ posts
- Grow your audience
2. Top Tweets
Head to your “Tweets” tab and click “Top Tweets.” You can select a specific date range to see your top tweets from that time period and how they performed. Here, you can see what content is performing best and easily gauge what your audience likes and is reacting to.
When analyzing your top tweets, ask yourself these questions:
- Why did people like this tweet? Was it funny? Authentic? Trendy? Something else?
- Why did I like this tweet? What encouraged me to post this?
- What other tweets would fit into this category? How can I continue to publish more content my audience likes?
3. Mentions
Mentions are in your main dashboard, and scroll to compare month over month.
Another underrated piece of data, mentions are great to see how many people are engaging and talking about you. As an athlete, fans tagging you things and commenting shows they’re paying attention to your content, your career, or both.
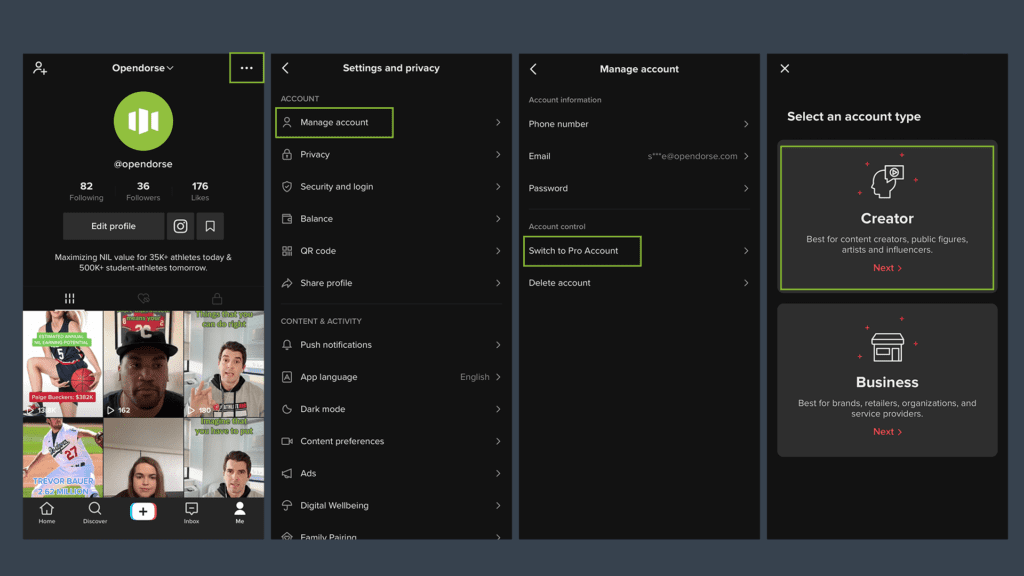
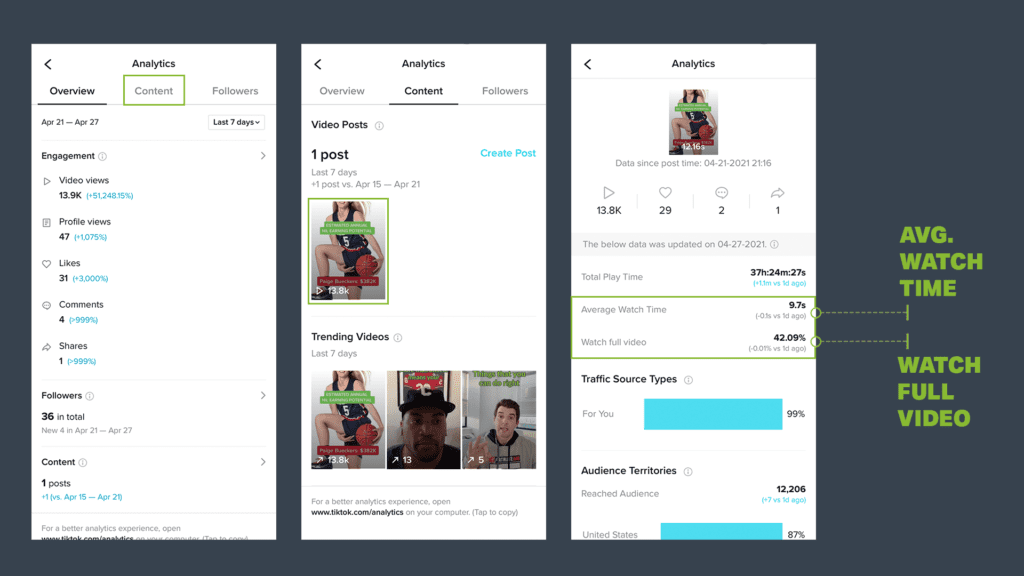
Tik Tok:
To view in-depth data on Tik Tok you’ll need to switch over to a Pro Account. When updating this, make sure you select “creator” to maintain access to trending music. Tik Tok limits business accounts from using certain music.
To update your account, go to your profile and tap the 3 dots in the top right corner, select manage account, tap select pro account, and select your account type as “creator.”
After you get your account switched over, you can access your analytics dashboard by going back to the top right corner where you’ll see a new option – “creator tools.” Click and head to “analytics” to access your dashboard.
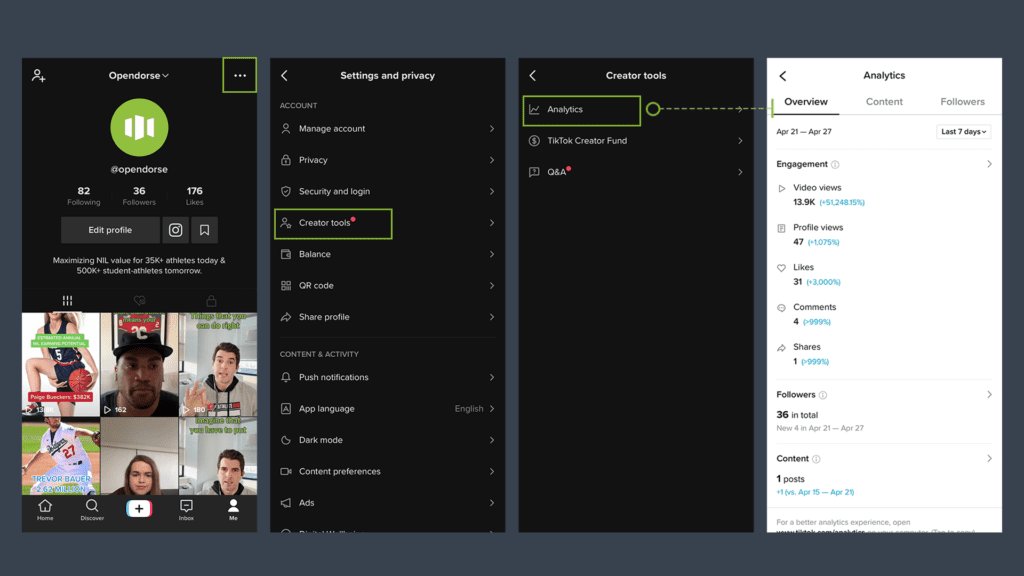
1. Average Watch Time
Average watch time is something every brand will want to know, and something that you can do to differentiate between good and bad content. The longer your watch time, the better-performing the video. It means the audience stayed engaged throughout the duration. You can also see what percentage of your audience watched your content all the way through. The higher this percentage, the better. If you want to boost this number, keep your content short. Tik Tok suggests videos that are 11-to-17 seconds perform best and keep your audience staying for the duration of the clip.
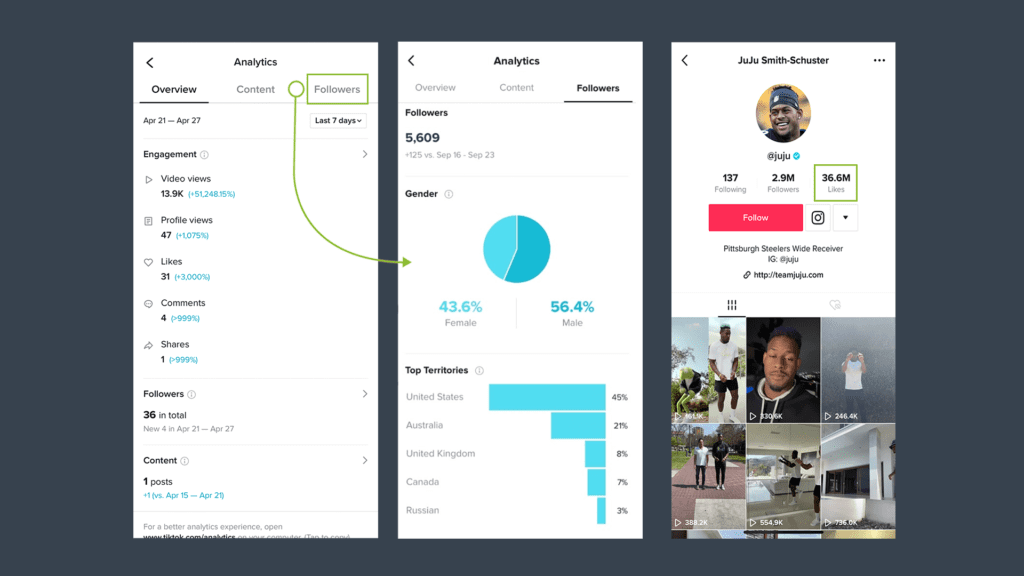
2. Followers Tab
To unlock this tab, you must have at least 100 followers. Tik Tok’s follower breakdown is extremely similar to Instagram’s and provides demographic data. Brands care about demographics and if your audience fits into their target demographic, you should be able to show this information to strike a deal.
Knowing your audience is equally important for your growth too. Knowing what types of demographics you’re hitting, you can tweak your content and continue tailoring to that specific audience viewing your content. If you’re aiming to hit a different audience, it could be a sign to really switch up what you’re posting. Use this data to fit your goals, wants, and needs.
3. Likes
Likes are super easy to view on everyone’s profile. Likes are just as valuable as followers because it’s an indicator of engagement. A high number of likes show that you’re posting frequently and your audience is interacting with the content you’re publishing.
To earn more likes:
- Post more frequently
- Tailor content to your audience
- Engage with other creators; comment on and like their videos
- Use 3-to-5 hashtags (a least 1 general and 2 specific) to increase discoverability
Linkedin:
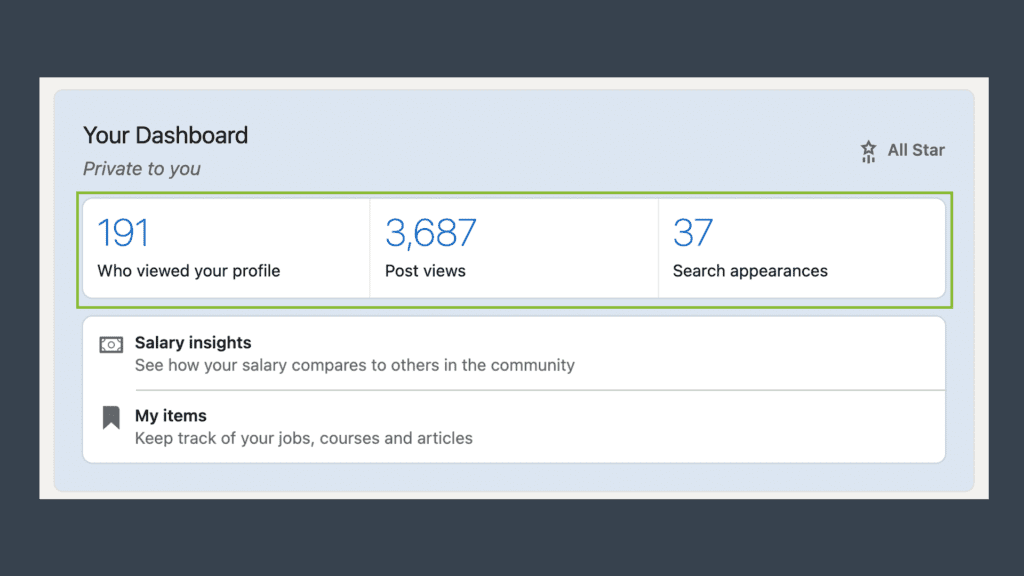
Your Dashboard is easy to view on your profile. Discoverability is a big factor on Linkedin and content lives on the home feed for a long time. Consistently comment, share, and post to see these numbers increase. It’s important to note that the Linkedin Dashboard gathers insights from the past 90 days.
1. Profile Views
Seeing who has viewed your profile, and how many views your profile receives is important. The more views your profile is getting, the more people who are viewing your skill sets and experience. To gain more views, comment on posts, share content, like content, and connect with others.
2. Post Views
If you want to see this number increase, the easy answer is, well, post. Post frequently, and you’ll see this number increase along with your other numbers across the dashboard. Simply share what you’ve been up to, a recent project you worked on that you enjoyed, or a recent lesson learned from participating in your sport. You’ll never know who your post could come across and how they could help you in your future career.
3. Search Appearance
Fill out your profile to increase your chances to come up in search. Be sure to include your school, sport, interests, major, and the fact you’re a student-athlete to rank higher in the search results.
Youtube:
Youtube has one of the best analytics dashboards out there and goes into so much depth. To access yours, head to https://studio.youtube.com/. If you’re using Youtube, take time to navigate the Youtube Studio and take a deep dive into analytics. To view your dashboard in-depth, click See more.”
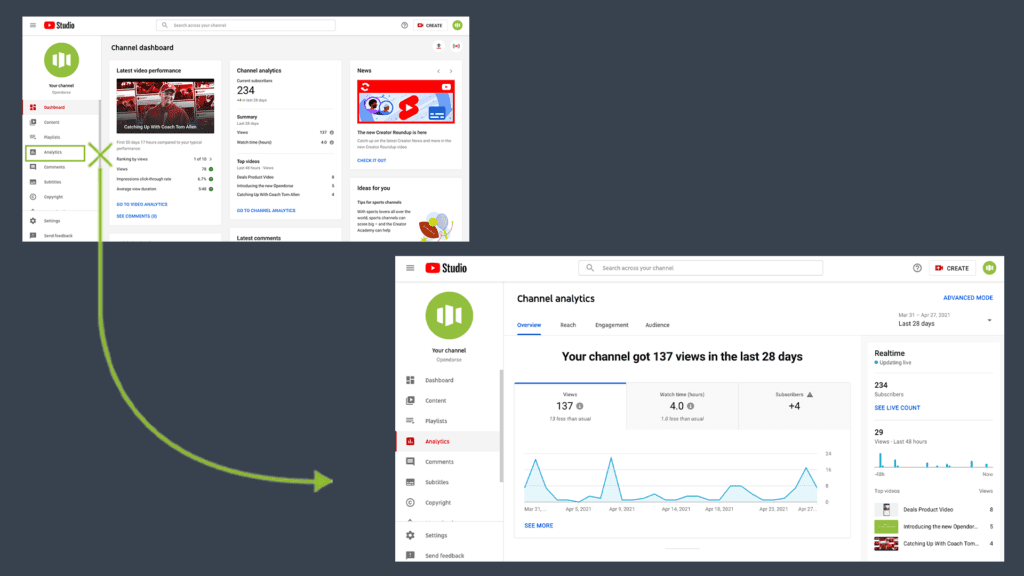
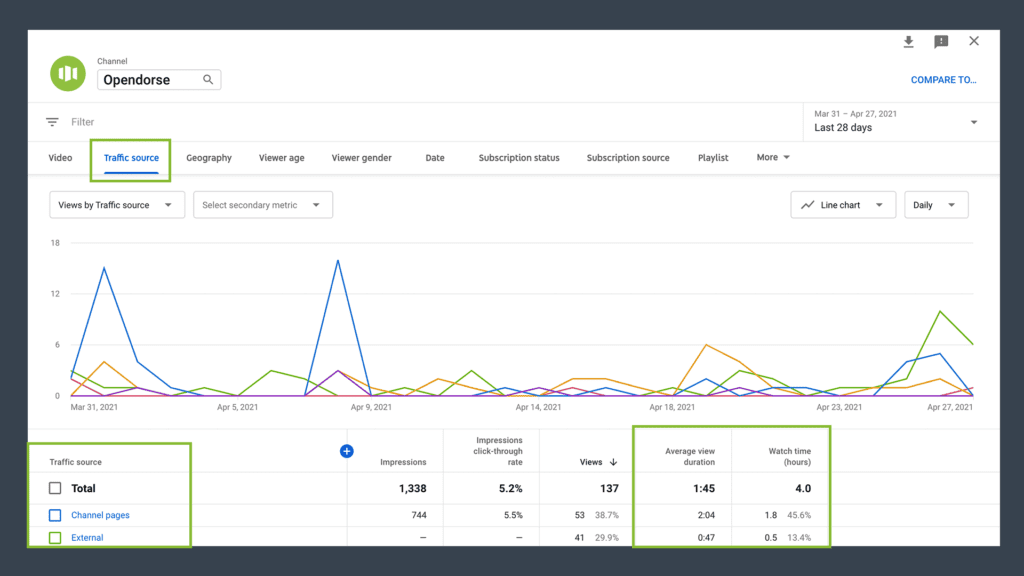
1. Average View Duration
Similar to Tik Tok, it’s important to understand how long your audience remains engaged. The attention economy is a tough market, so the longer the view duration is, the more engaged your audience. Quality is more important on Youtube – take time to understand your audience and create content they don’t want to leave.
2. Watch Time
You might be asking how does average view duration and watch time differ? Watch time is the total time-watched for all your video content. To get this number to increase, continue to create new videos. If you want to get this number to increase without producing a new piece of content, plug your previous posts on your socials channels and bring attention back to it.
3. Traffic source types
See exactly where your followers are coming from. Are they coming from searching Youtube or an external source like a link to the video you tweeted? Understanding where your viewers are coming from will help you identify where you should be promoting your videos or different avenues to focus on where you could be bringing more viewers in.


Trackbacks/Pingbacks